Analytics
Userflow provides out-of-the-box analytics for how your users interact with your flows, checklists and launchers.
In this guide, we’ll break down the Analytics page, which you find next to the Builder.
If you’re looking for more in-depth analytics, and the ability to correlate flow usage with other user interactions, take a look at some of our Integrations with analytics providers such as Mixpanel and Amplitude.
- Flow Analytics
- Checklist Analytics
- Launcher Analytics
- Resource Center Analytics
- Survey Analytics
- Dashboard
- Exporting analytics data
Flow Analytics
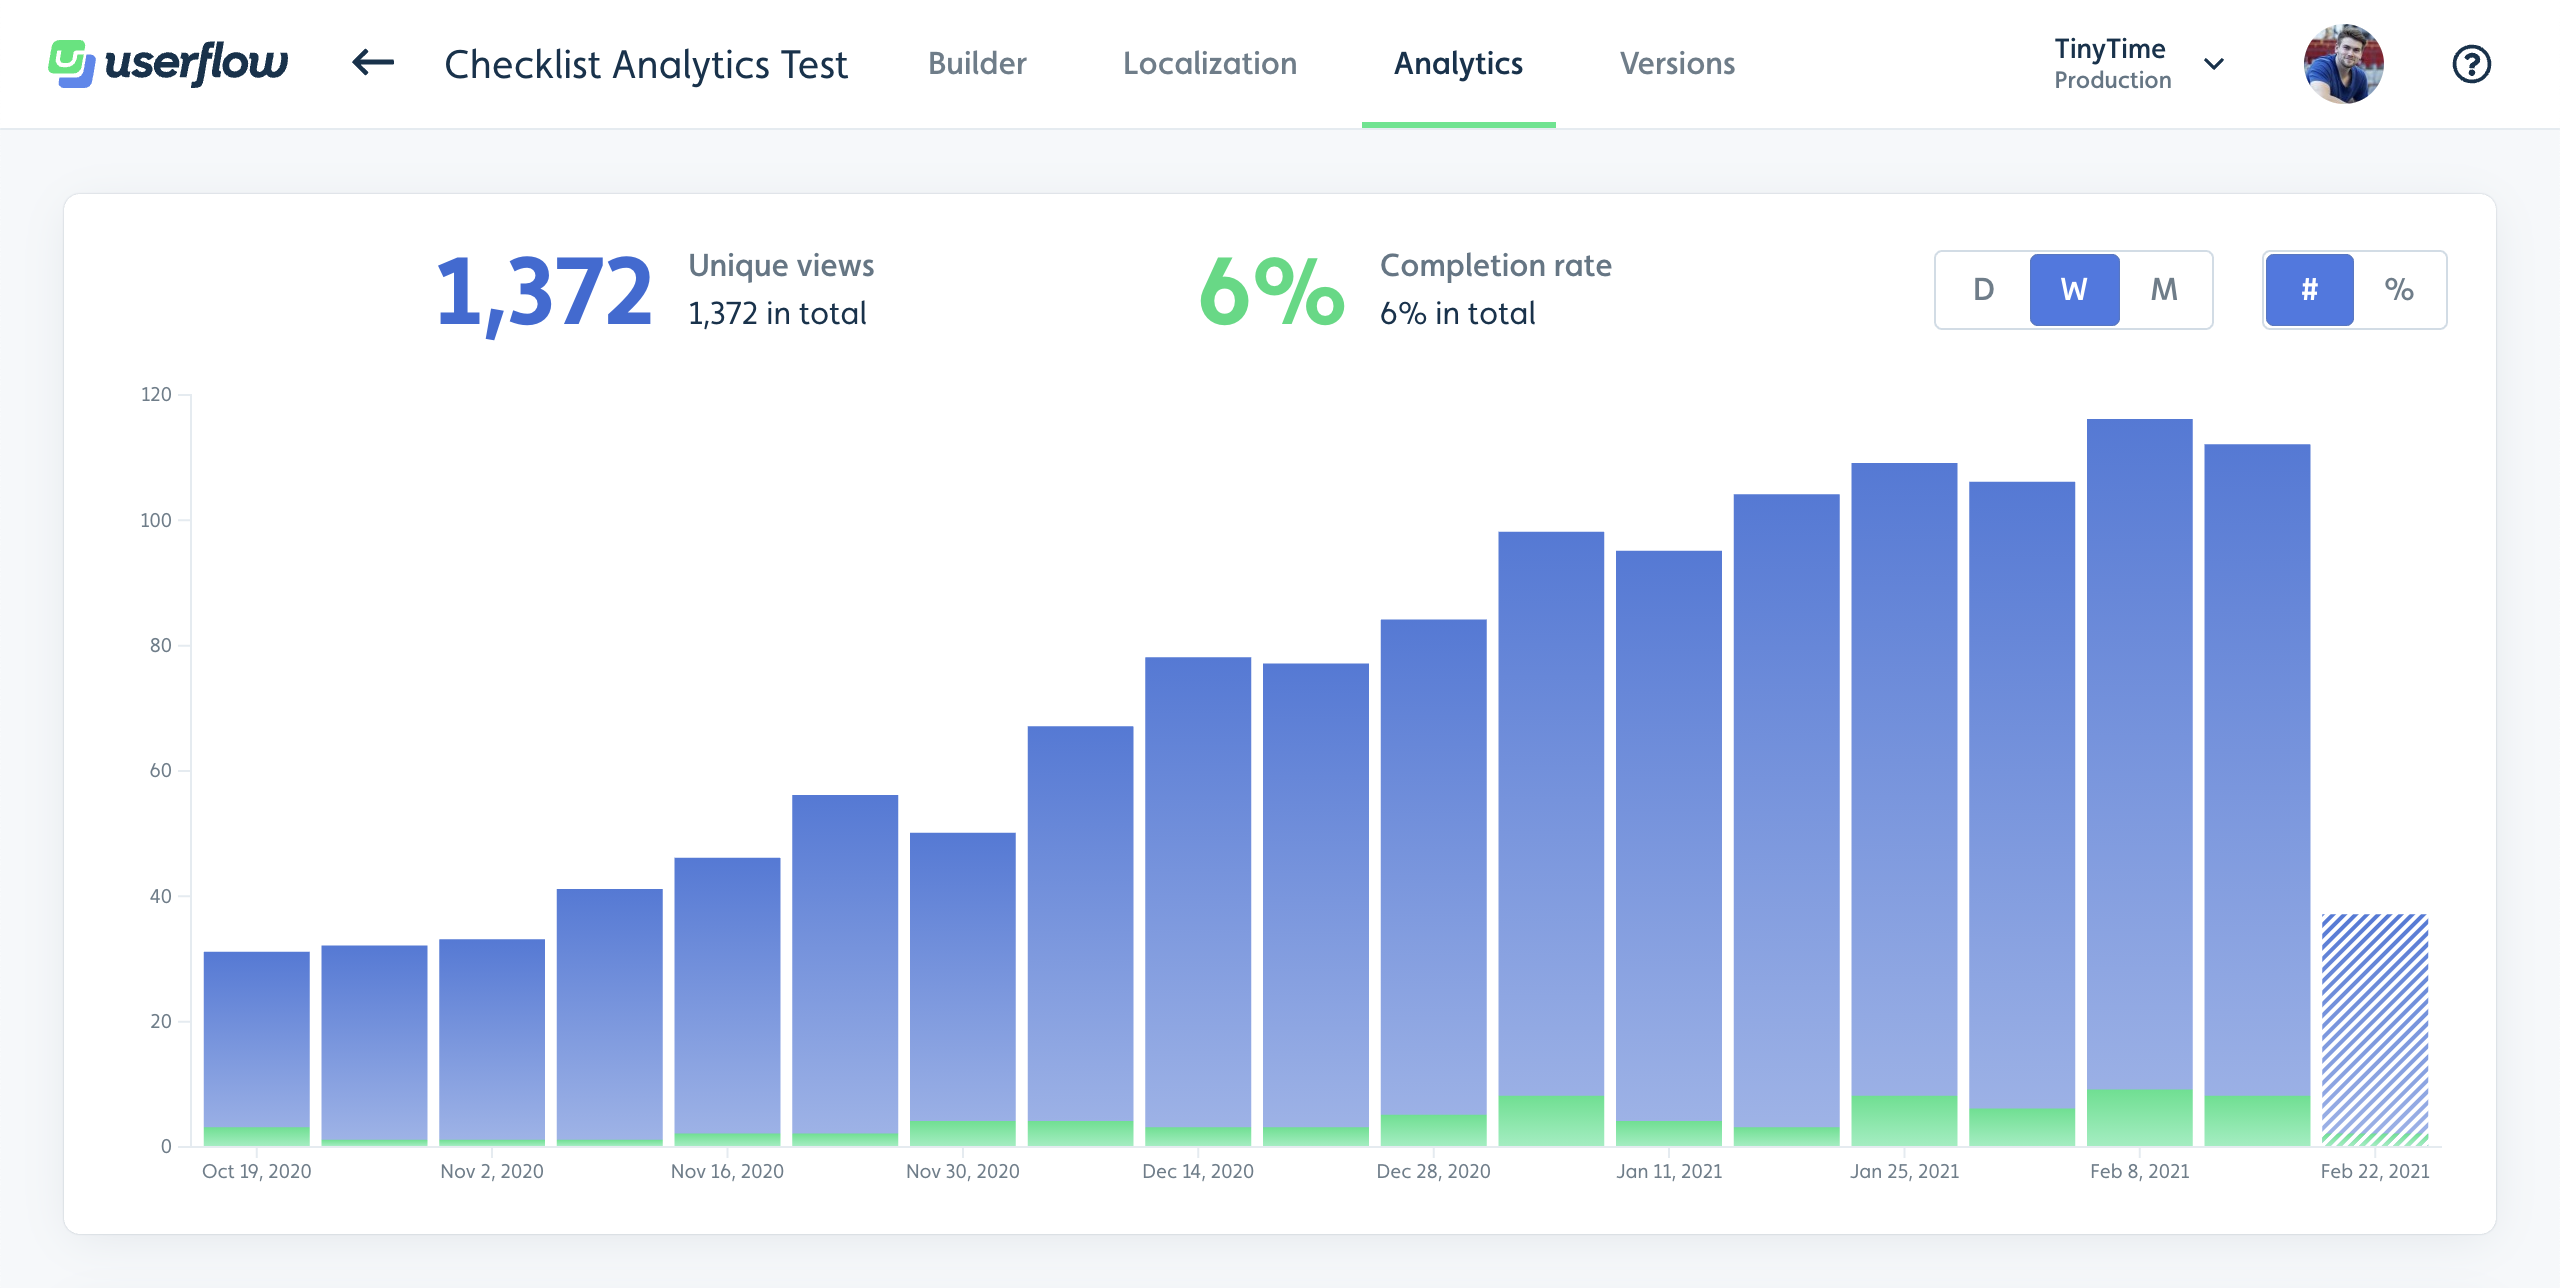
Views and completion rate over time
The Analytics tab under a flow shows how many users have seen your flow over time.

- Unique views tells you how many unique users have seen the flow in total. There’s also a total number of views, which may be higher if some users have seen the flow multiple times.
- Completion rate tells you the ratio of users that saw the flow who also completed it.
- The blue bars indicate views from users that did not complete the flow.
- The green bars indicate completions of the flow.
- The last/right-most bar may be striped, indicating that this period is not over yet, so its numbers are expectedly lower.
- Hover over the bars to see exact views and completion rate for a specific time period.
- Use the D, W and M buttons in the top right to switch between bucketing by Day, Week or Month.
- The # button will make the chart show in absolute numbers, while the % button shows it on a relative scale. The latter is useful to see if the completion rate goes up or down over time regardless of whether the flow is seen more often.
Step funnel
The Step funnel shows you where users drop off in the flow.

- Unique views shows how many users saw each step.
- View rate shows the share of users that saw the step relative to the total number of users that saw the flow.
- The width of the green bar corresponds to the View rate.
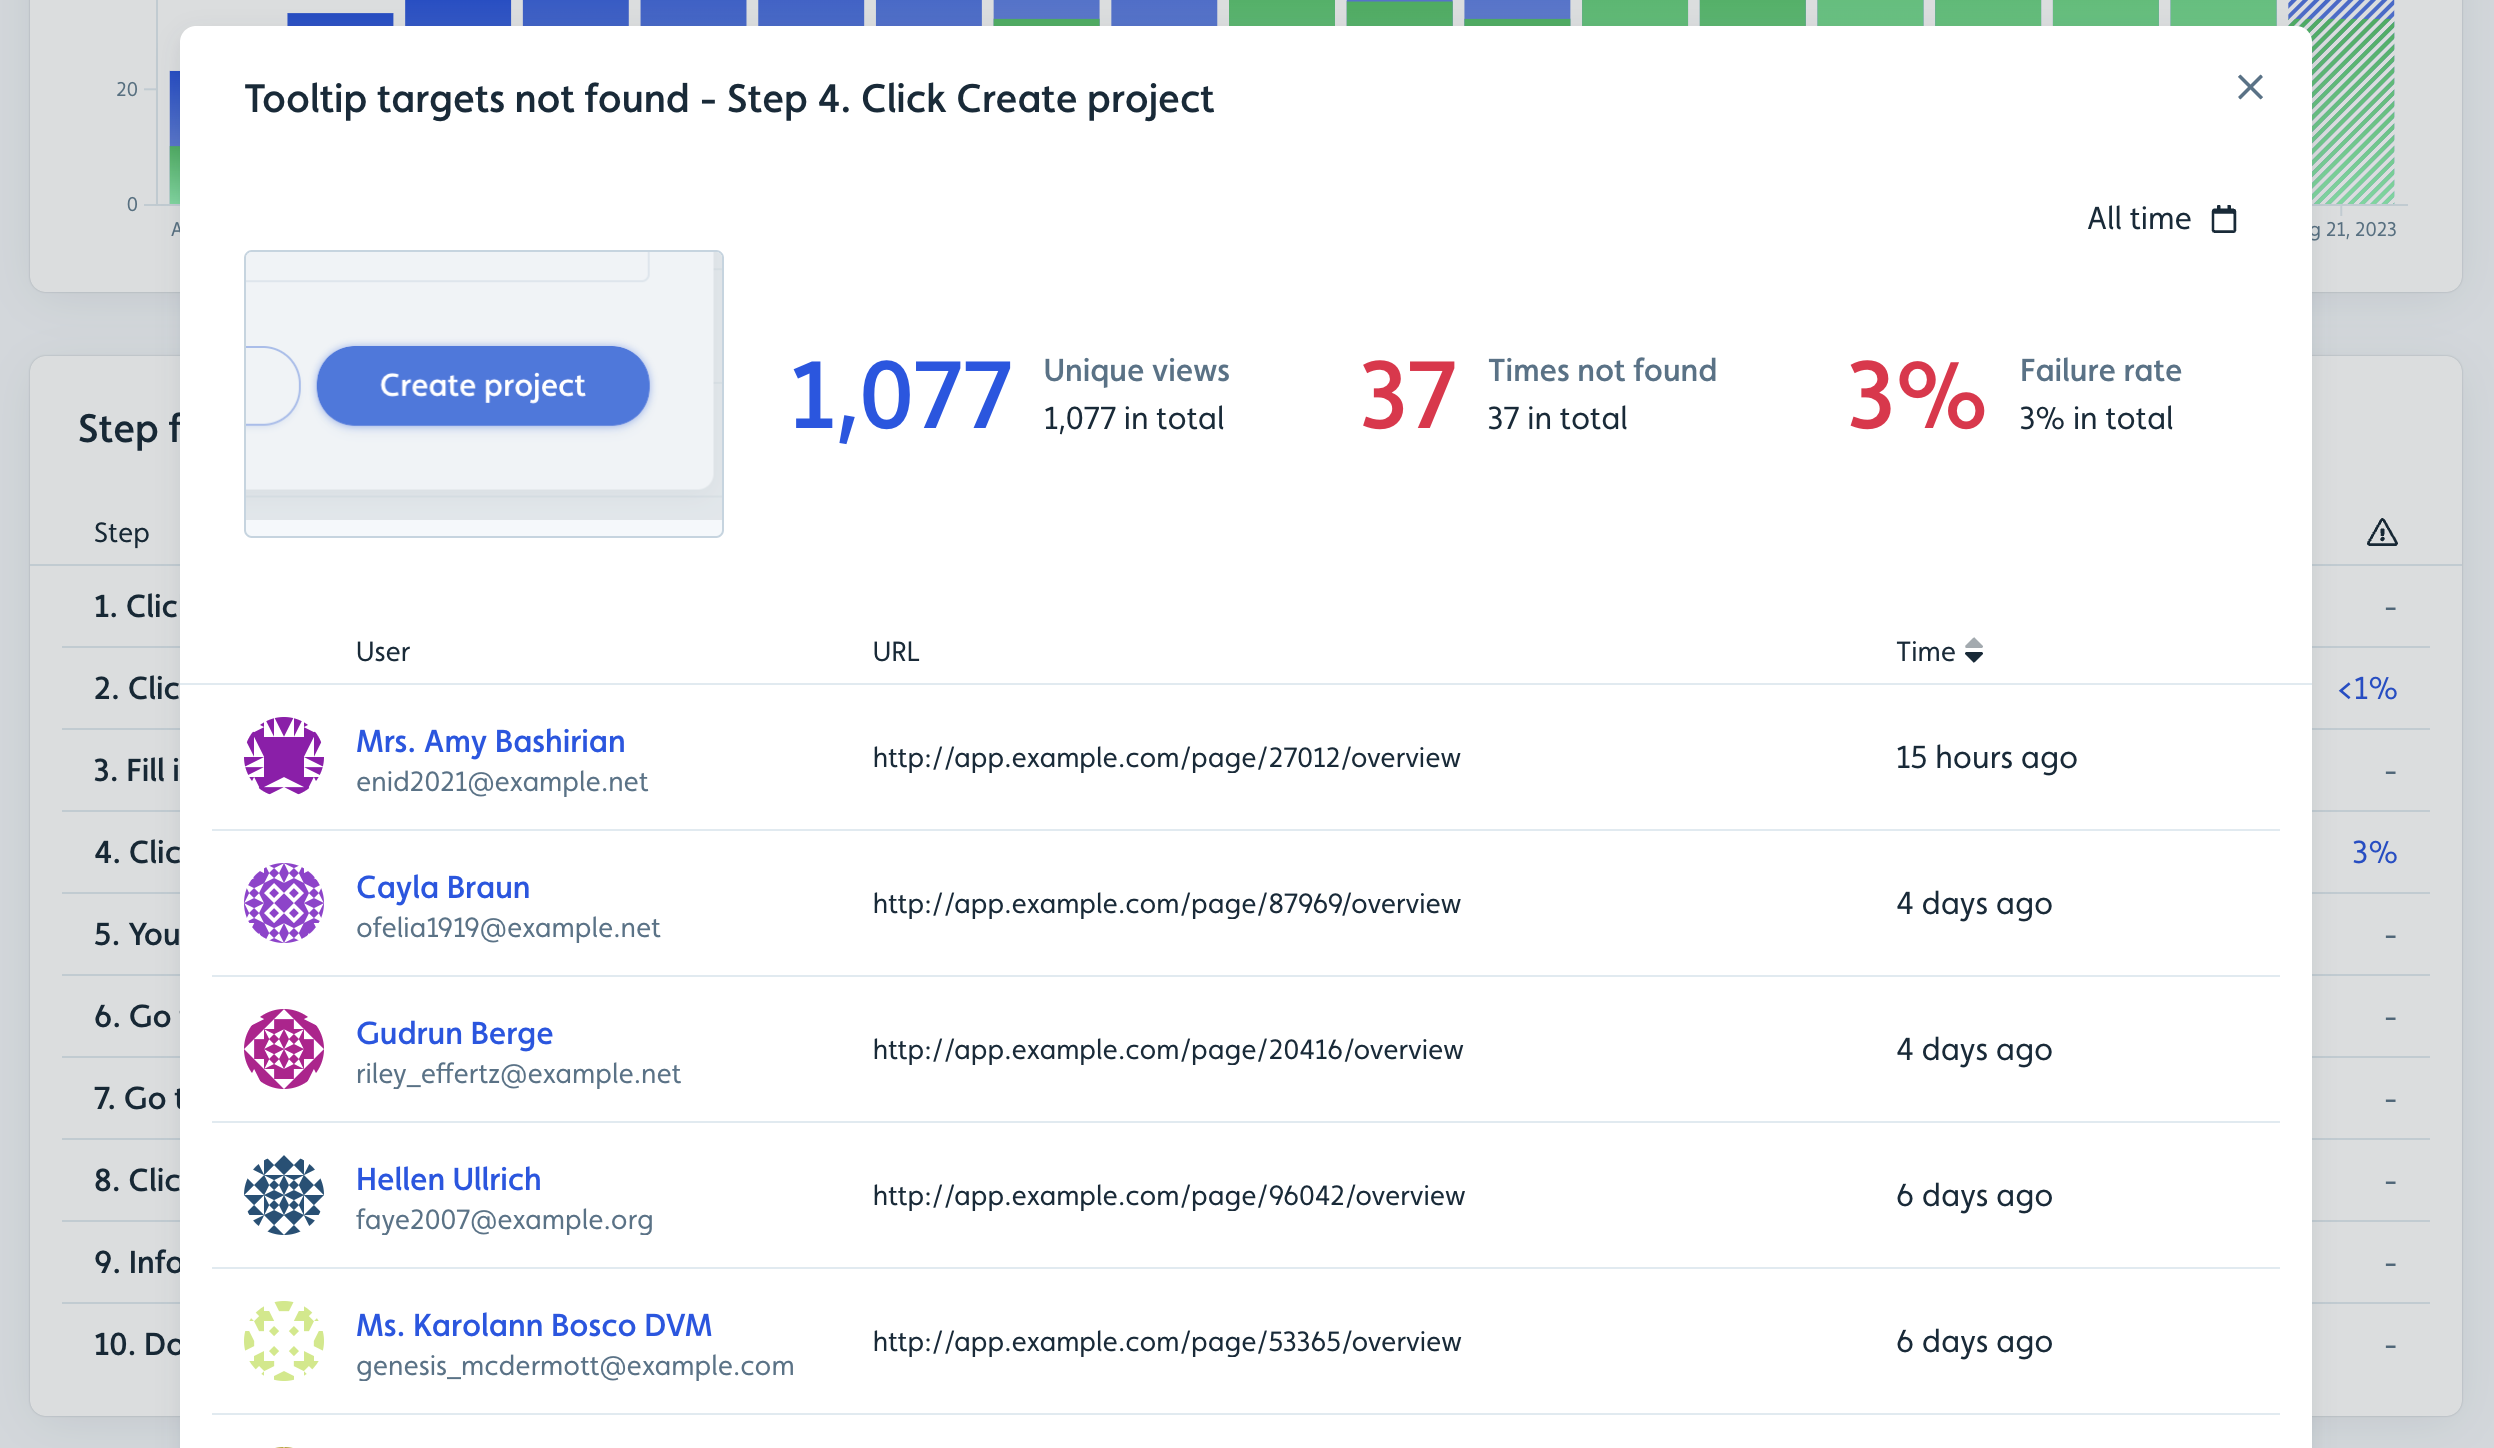
- The column with the exclamation triangle icon represents Tooltip targets not found, i.e. the percentage of sessions where a tooltip step’s target element could not be found in your app.
- If your flow is linear, the shape of the bars will resemble a funnel (wider at the top, narrower at the bottom).
- If there’s a steep drop after a certain step, it’s a hint that users have a hard time continuing from it or simply lose interest. Consider previewing the flow and look for issues, shorten the flow and/or make the content more concise and engaging.
- Note that if the flow has branching or steps that can be skipped, the chart may not look like an actual funnel, since a step’s bar may be shorter than a later step.
You can click the percentage numbers in the Tooltip targets not found column, if any, to see all the users it happened for, including which URL they were on:
Recent sessions
A session is a user’s journey through a flow and corresponds to a view. A user may have multiple sessions of a flow, which will result in multiple views (though only 1 unique view).
This list shows users that most recently saw the flow.
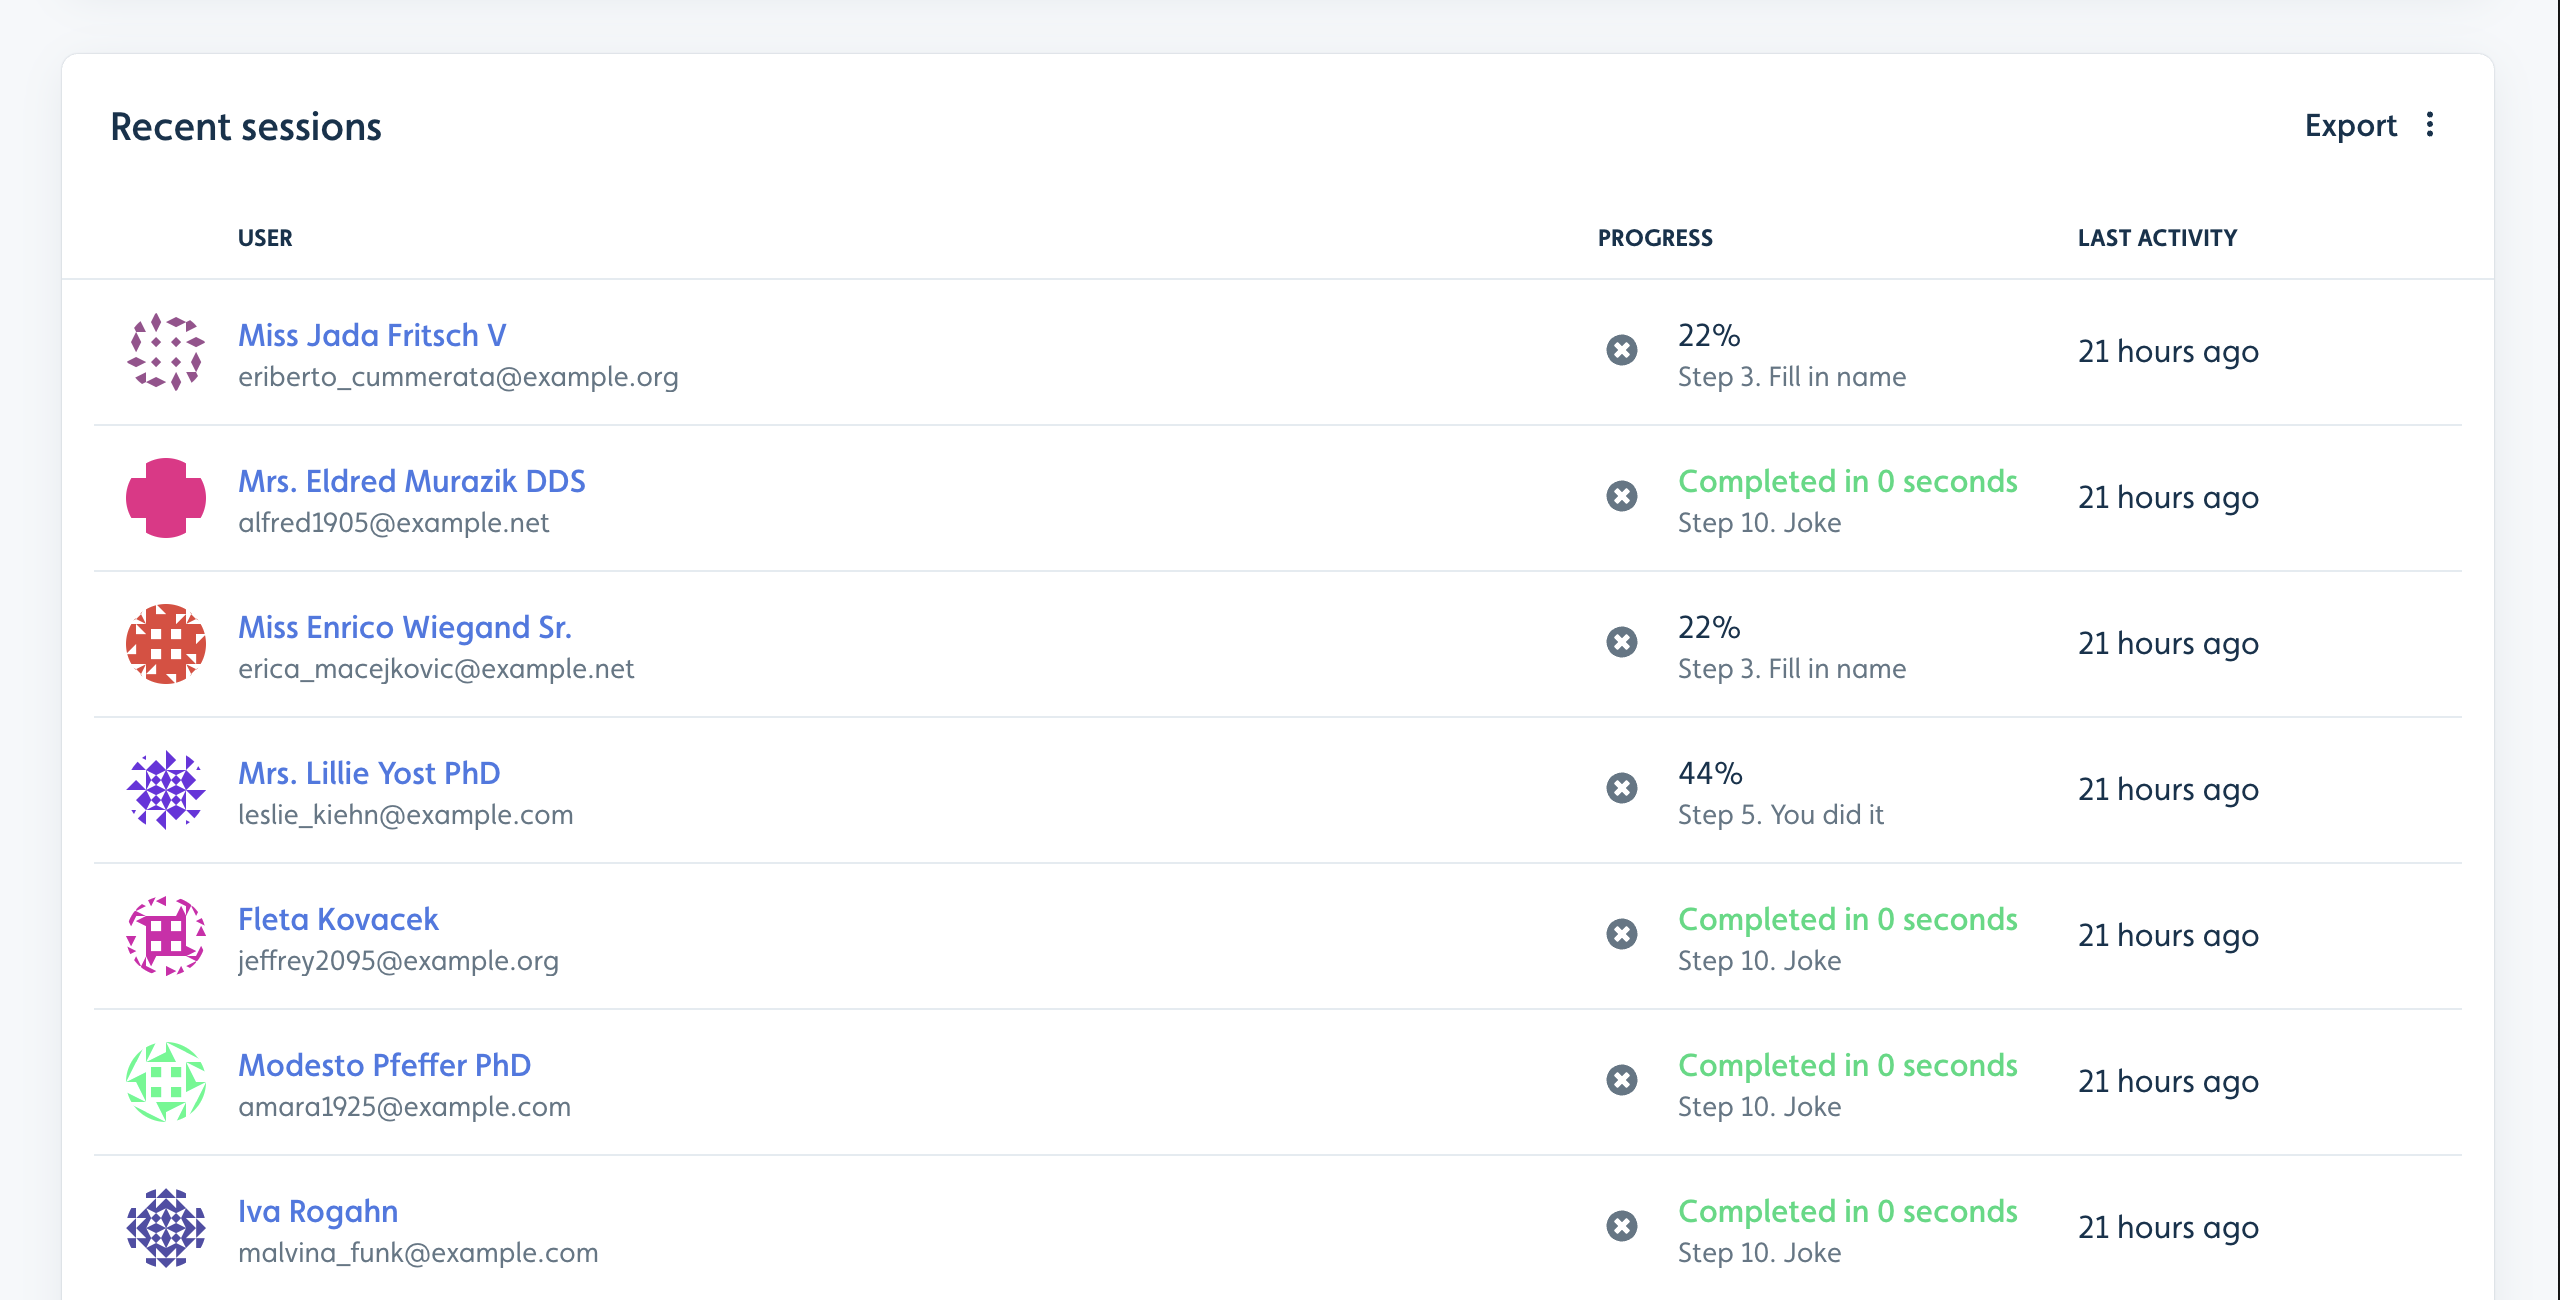
- You can click a user’s name to go to their profile, or click an individual row to view more information about the session.
- Each row contains the session’s current progress: How far they’ve gotten, whether they’ve completed/dismissed the flow, and which step they’re currently on.
Checklist Analytics
Views and completion rate over time
The Analytics tab under a checklist shows how many users have seen your checklist over time.
The information is the same as what we saw under Flow analytics.
Task breakdown
The Task breakdown shows how many users completed each task.
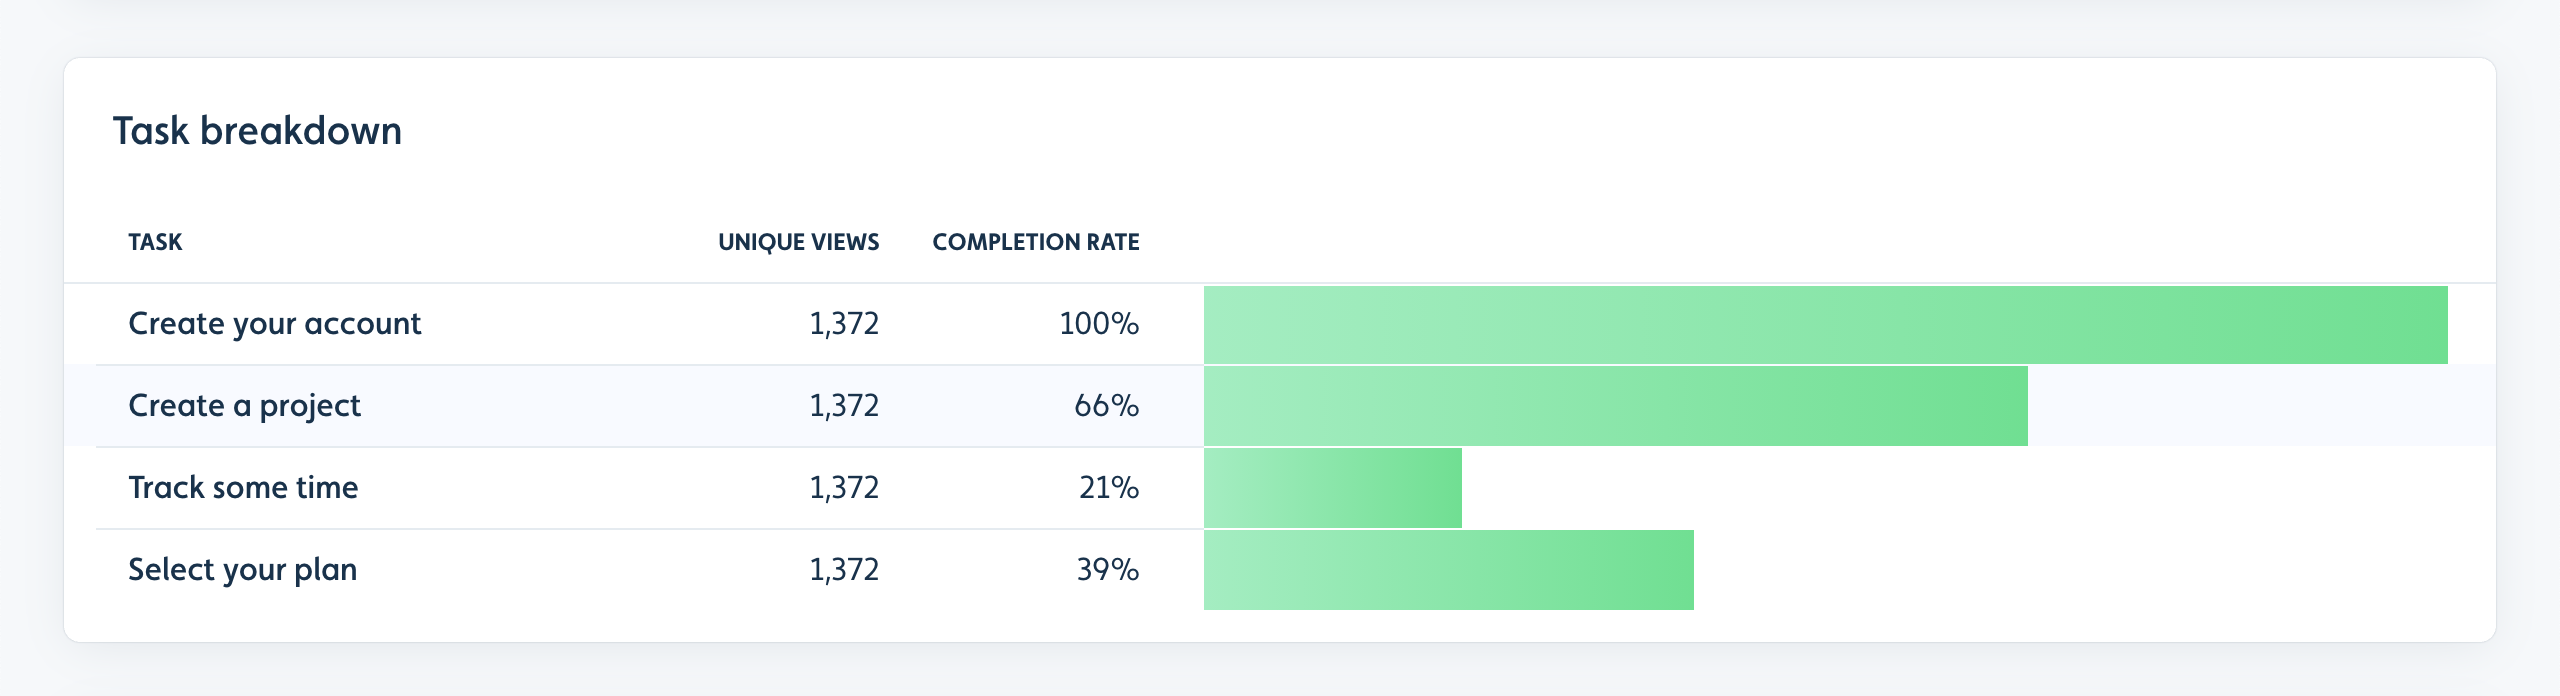
- Unique views shows how many users saw each task. If the task has an Only show task if condition, this number may be lower than the total number of users that saw the checklist.
- Completion rate tells you how many users completed this task relative to how many users saw it.
- The width of the green bar corresponds to the Completion rate.
Recent checklist sessions
Under Recent sessions you can see users who’ve most recently seen the checklist, much like for Flow analytics.
Launcher Analytics
Views and activation rate over time
The Analytics tab under a launcher shows how many users have seen your launcher over time.
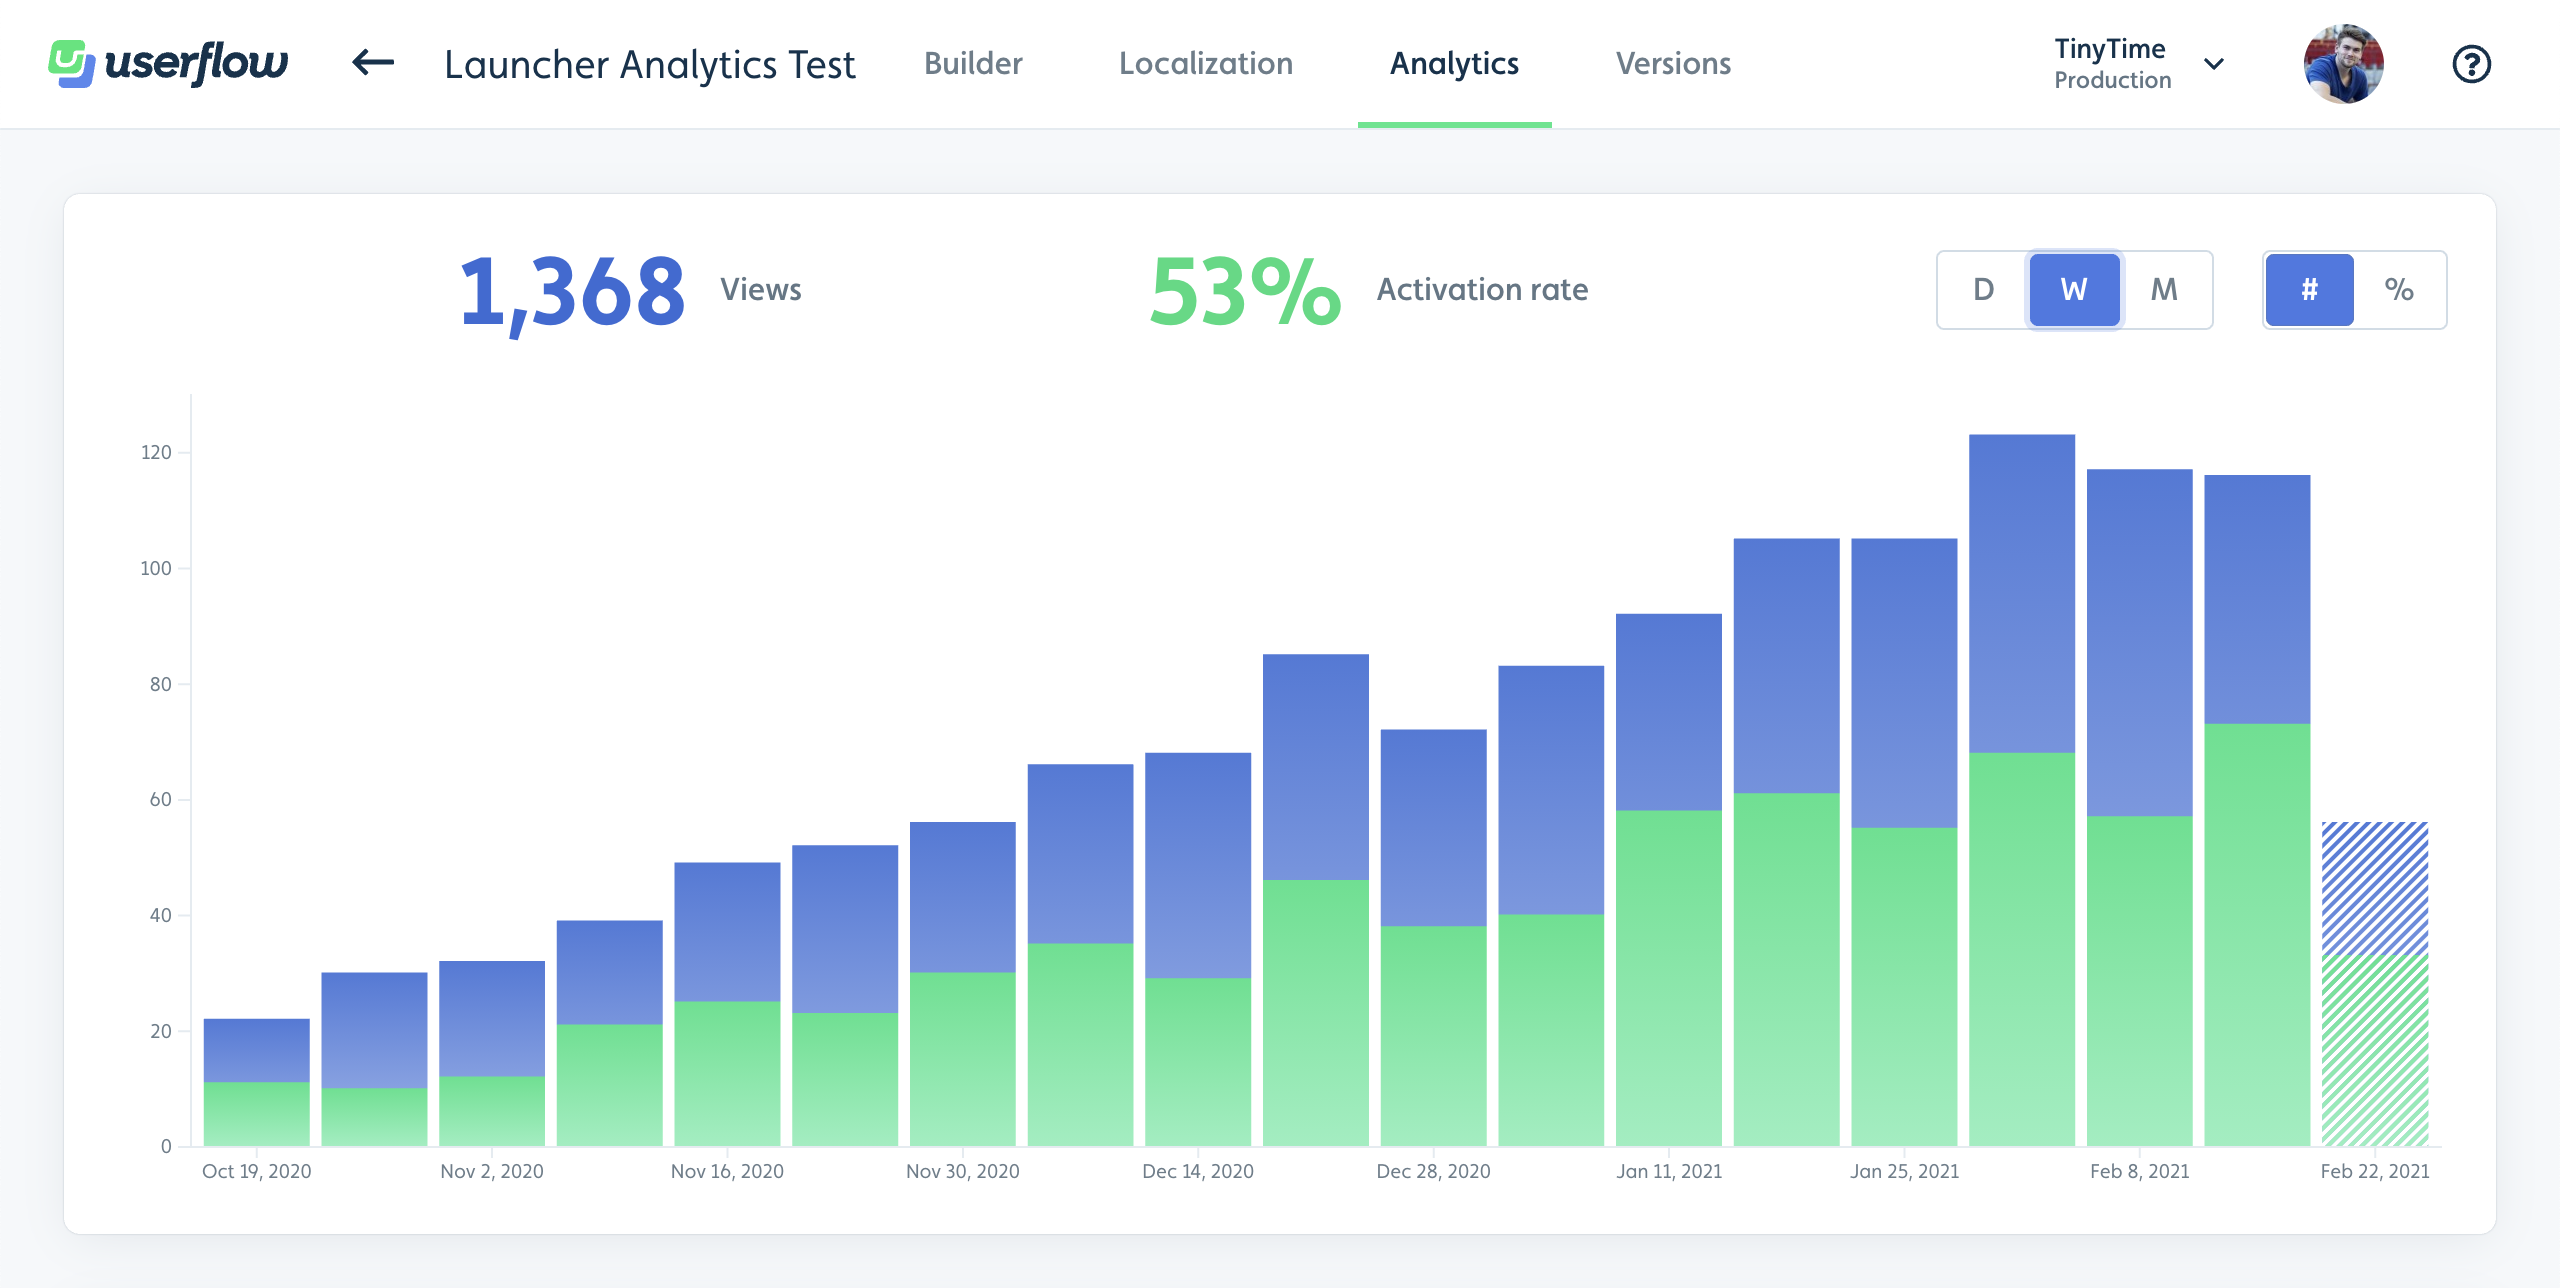
- Views shows how many users. A view is only counted once per user, meaning even if a user sees the launcher many times, they always only count once.
- Activation rate shows how large a share of users that saw the launcher also activated it, e.g. by clicking or hovering over it.
Recent sessions
Under Recent sessions you can see users who’ve most recently seen or interacted with the launcher, much like for Flow analytics.
Resource Center Analytics
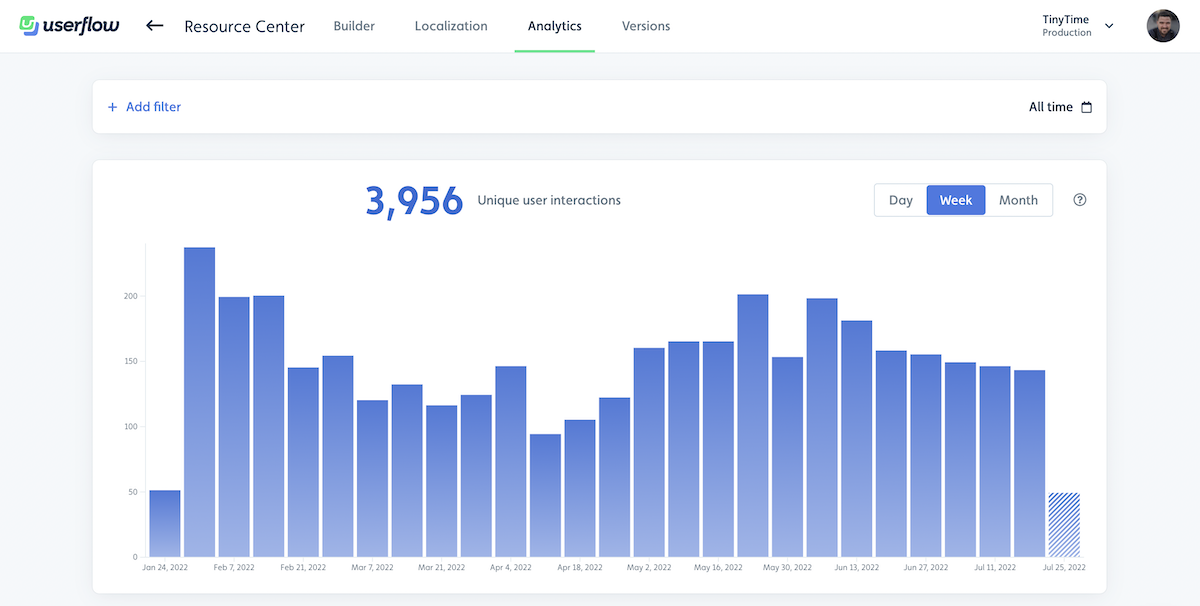
Interactions over time
The Analytics tab under a Resource Center shows how many users have interacted with your Resource Center over time.
Click breakdown
The Click breakdown shows how many users clicked on a given item in the Resource Center..
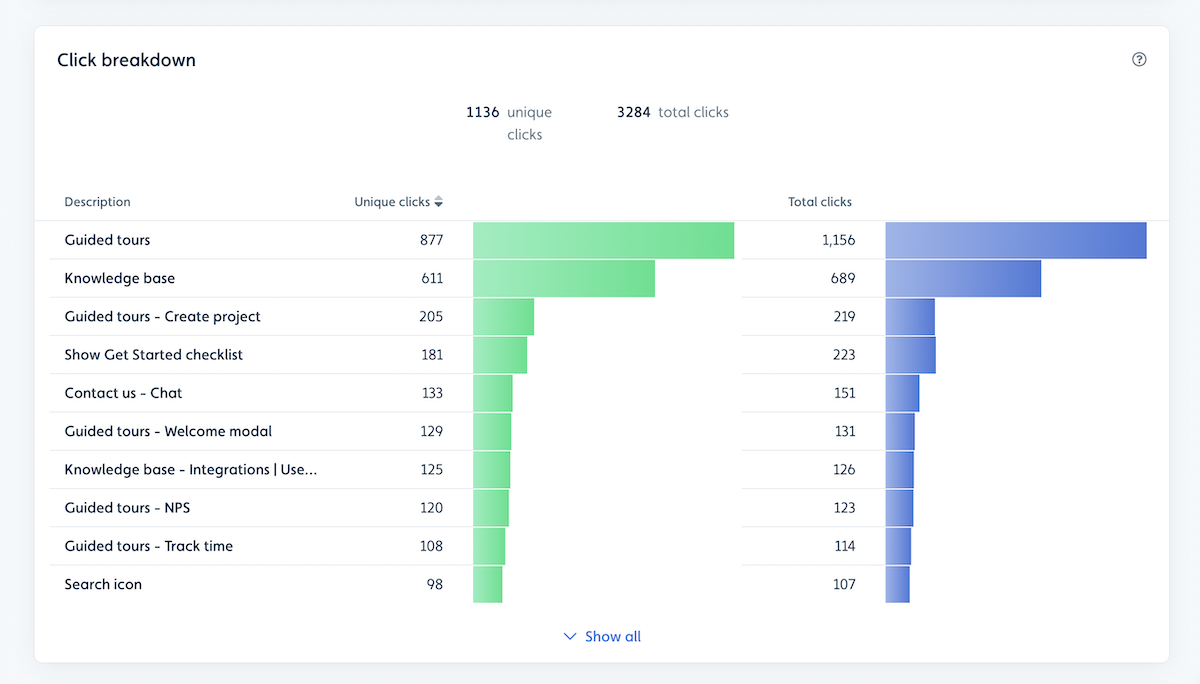
- Unique clicks shows how many unique users clicked on each item.
- Total clicks tells you how many total clicks each item has, as one user can click on the same item multiple times
Recent Resource Center Sessions
Under Recent sessions you can see users who’ve most recently interacted with the resource center, much like for Flow analytics
Survey Analytics
You can read about Survey analytics in the Surveys guide.
Dashboard

The dashboard in Userflow provides a centralized view of key performance metrics across all of your content types—flows, checklists, launchers, banners, announcements, and the resource center.
Why Use the Dashboard?
With all of your key insights in a single view, it’s easy to monitor and optimize content performance. Here is how the dashboard can help:
-
Enhance onboarding efficiency
Track unique views and completion rates for flows to understand user engagement from start to finish. High completion rates indicate effective guidance, while low rates may signal areas for improvement. This data can help you refine flows to ensure a smooth onboarding experience for new users. -
Boost engagement with key content
Identify top-performing checklists and flows to replicate their successful elements across other content. For low-performing content, use insights from completion and activation rates to pinpoint where users may drop off, and make targeted improvements to increase engagement. -
Proactively manage alerts
The dashboard’s active alerts section notify you of any issues within flows, checklists, or launchers. Clicking an alert takes you directly to the relevant analytics report, allowing you to investigate and address potential roadblocks in real time, helping maintain a seamless user experience.
These use cases demonstrate how the dashboard can streamline content management, support data-driven improvements, and enhance user interactions across your content.
Accessing the Dashboard
- Access the dashboard by clicking on the Userflow icon in the top-left corner.
- Available to all team members, the dashboard reflects data specific to the selected environment.
Dashboard Features
-
Live content overview
- Displays counts of your live content types (flows, checklists, launchers, banners, resource centers, and AI assistants) in the environment.
- Each count is clickable, linking to the corresponding content list view.
-
These counts remain unchanged even when filters are applied.

-
Current active alerts
- Shows active alerts for flows, checklists, and launchers (if enabled). Clicking on an alert navigates you to the corresponding analytics report for detailed insights.
- This section will show “No active alerts” if none are present.
-
‘The ‘Manage alerts’ button directs you to the alert settings, where you can create, edit, or delete alerts.

-
Filtering options
- Date range filters are available: past 30 days (default), past 3 months, past 12 months, and a custom range (up to the last 12 months).
- These filters only apply to widgets below the filter bar and do not affect the overall content count or alerts.
-
Content-specific tabs
- Each content type has a dedicated tab for focused analysis (e.g., flows, checklists, launchers).
- Selecting a tab displays metrics specific to that content such as views, completion rates, and activation rates.
Analytics Widgets by Content Type
Each content type includes a deeper view into specific metrics:
-
Flows
- Unique views tells you how many unique users have seen all the flows in total. There’s also a total number of views, which may be higher if some users have seen the flows multiple times. This metric helps assess user reach and engagement—unique views shows new user interaction, while total views indicates repeated visits, highlighting areas that may need more clarity.
- Completion rate tells you the ratio of users that saw any of the flows to those who also completed that flow.
- Top performing flows contains a list of your top 5 flows with the highest completion rates, indicating strong user engagement and effectiveness in guiding users through tasks.
- Lowest performing flows contains the 5 flows with the lowest completion rates, suggesting potential issues with user engagement or flow clarity that may require optimization.
-
Checklists
- Unique views shows how many unique users viewed all checklists.
- Completion rate tells you how many users completed the checklists relative to how many users saw it.
- Top performing checklists contains a list of your top 5 checklists with the highest completion rates.
- Lowest performing checklists contains the 5 checklists with lowest completion rates.
-
Launchers:
- Views shows how many unique users have seen launchers.
- Activation rate shows the percentage of users that saw the launcher and also activated.
- Top performing launchers is a list of the launchers that have the highest activation rates.
- Lowest performing launchers is a list of the launchers with the lowest activation rates.
- Banners and Announcement show a graph with total views across the selected time range.
- Resource Center shows a graph of total interactions that occurred with the resource center over the selected time period.
- Event Tracker shows the graph of total events triggered vs. the unique events tracked.
- AI Assistant shows a graph that includes metrics for messages received, likes, and dislikes.
Plan Requirements
The dashboard is available for all customers.
This feature provides a consolidated view to help users efficiently analyze content performance across Userflow.
Exporting analytics data
Userflow offers two ways to export the underlying analytics data for flows, checklists, resource centers, AI assistants, launchers, and surveys to other tools.
- By sending the events data (e.g. flow completed etc.) to other tools via our Integrations, API, or webhooks.
- Via CSV export of the analytics session data by going to each contents respective Analytics tab and clicking the Export button next to Recent sessions.
